Big Data

Visually Speaking with Andy Kirk

leaving the “shouty, big numbers about nonsense topics” behind us…

Knowledge, isn’t an “ah ha” moment or eureka exclaiming euphoria. It’s a process of building on the thoughts, on the imaginations, and connecting with the historical musings of others. Straight lines or specific points aren’t the paths or places that get us to saying with absolute certainty, “I know all about this discipline or everything about that school of thought.” Getting to know is more like revelling in the wanders through our minds maze. There’s wonder in gathering and connecting ideas.

I know some stuff about visualizing data and information. But, everyday’s a humbling reminder of how much I don’t know. Visualising Data is a spark of imagination that helps me see information as meaningful beyond the written form. Hearing Andy Kirk speak on the subject, and subsequently connecting with with him in person has meant a lot.

Andy kindly included me in one his series of short articles titled ‘six questions with…’. It’s a pleasure share some of his thoughts. Here’s my three questions with Andy Kirk.

1) Since 2007 what’s happened (trend or event) in the data visualization world that’s surprised you the most? And subsequently, what trend or event unfolded in a manner close to what you may have predicted? The retrospective crystal ball moment 🙂

“When I discovered the data visualisation world in 2007 one of my initial predictions was that by now (2016) we would have specialist people in organisations of all shape and size whose job title would be quite explicitly dedicated to being a ‘data visualisation’ professional. What has happened instead, in my view, is that data visualisation capabilities are increasingly being absorbed my a broader range of people alongside their other duties. I feel it is becoming an expected part of the contemporary professional’s skill-set, given that working with and communicating with data is becoming ever more ubiquitous.

I suppose the only positive prediction I would have made that has materialized is simply that visualisation is not and will not be a passing fad. Some practices will come and go, tools will evolve but the underlying need for visualisation has and will be sustained.”

2) In the last year or two, what data visualization project (or projects) have you seen with the most impactful human qualities about them? Where you’d not only say Wow! But, you’d more importantly say, “I didn’t know that, but it’s sure something as a society we need to know about and take action on.”

“This is a hard question to answer simply because I have the curse of being unable to switch off my lens as a visualisation designer and educator. When I see a visualisation project I find it nearly impossible to ‘just’ be a reader or consumer, instead I immediately start to forensically dissect the design and analytical choices I see — what charts they’ve used, how they’ve combined colours, what architectural composition they’ve employed…

That said, the two projects that stand out as immediately resonating with me on the simple basis as a reader were — ”

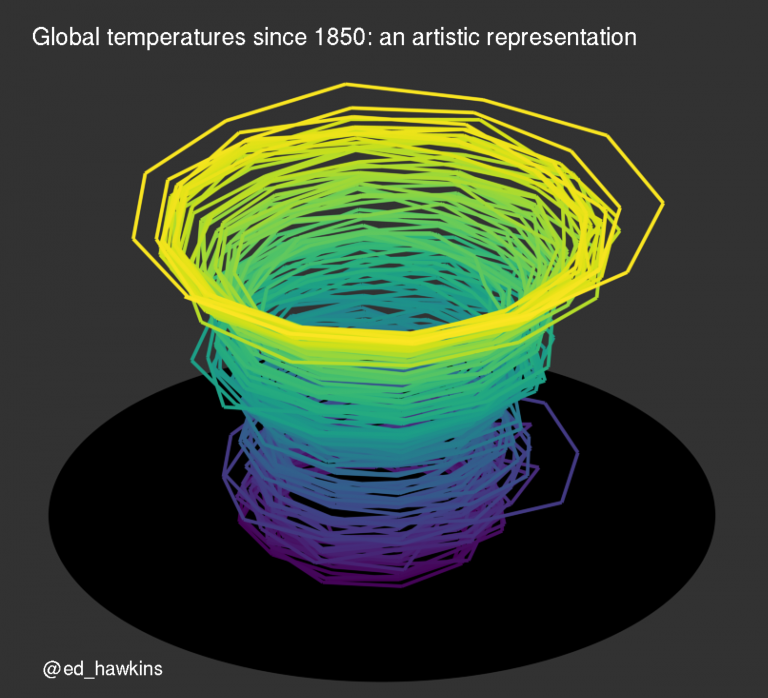
Climate Spirals — portraying quite profoundly the story of temperature changes.

And this…….

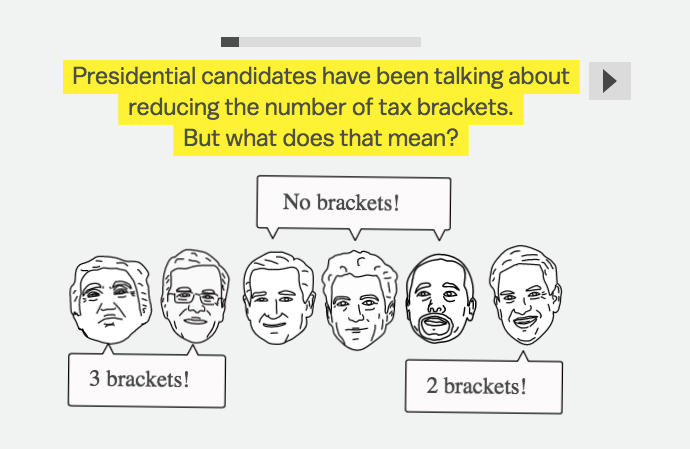
100 years of tax brackets — which in my interpretation portrays a proxy story of the rise of wealth inequality.

3) Looking into your crystal ball. What’s the one trend in data visualization you’d like to see become a thing of the past (not good for us)? Why? Turn that around, what’s one trend we’re not collectively talking about today, that one day we’ll be saying… this is a difference maker?

“I think we’re starting to see the decline of the trashy infographic — the 600px wide, 100000px long tower posters. These aren’t infographics in their purest sense, rather they tend to portray shouty, big numbers about nonsense topics with little or no demonstration of good visualisation principles. Probably between 2010 and 2014 it was at a peak and arguably damaged the ‘brand’ of the craft of infographic design. Thankfully I’ve seen a steady reduction in these types of work.

I think the biggest trend that will be a difference maker IS actually being talked about (so not answering the question!) but is something I feel has only come to the surface this year — that is the movement towards placing more emphasis on explanatory visualisations than interactive exploratory ones. Archie Tse of the New York Times discussed this at Malofiej conference— its about demonstrating ever more discerning judgment towards the value of the clicks/taps you task your audience with. It is about removing the gratuitous and unnecessary obstacles towards understanding, taking more responsibility to impart that understanding rather than leave it to readers/users to find themselves.”

_________________________________________________________________

Think about adding Andy’s book Data Visualisation to your reading list.

From the pen of John (cofounder)

Please visit Mentionmapp today!

Knowledge is More Than a Point of Data.

Photo courtesy http://markusspiske.com/

Every month, with clockwork like precision a brown paper package arrives in the mail. The unwrapping is revealing. For almost 50 years the National Geographic has been enriching my imagination. The connectedness to ourselves, to our planet and cosmos is like a lattice of human context. It’s also an important source for our visual and aesthetic literacy. I see our graphically visual world as distinctly human, whereas raw data points have no human essence. There should be no mistaking data for knowledge.

Big Data, and data visualization are important topics. But it’s troubling when they’re stories reduced to little more than ill-defined link bait. Accepting there’s also no unified theory or singular definitions for either data or it’s visualization is important too. We can discern between structured (bits of ledger) and unstructured data (streams of social chatter), but data itself is simply the columns and rows fodder. It’s the slices of pie in that fill a chart. Spreadsheets and pie charts are meaningless artifacts. It’s the art of asking questions that brings them to life. Transforming crumbs of data into information, in turn gets us to the possibility of knowing.

Without structure, data doesn’t become knowledge. It’s like looking into a murky swamp and trying to understand the dividing properties of an amoeba. Try viewing it in a petri dish instead. Appreciating when there’s no structure, there’s no meaning attracted me to Manual Lima’s book Visual Complexity. It’s influenced my appreciation of visual literacy. It was also cool seeing Mentionmapp on page 153.

With a historical context and framework of techniques and best practices, Visual Complexity also help me discover other visualization leaders (who we’ll write about in future posts). Lima’s depiction of the visualize network being “the syntax of a new language,” made an impression. Knowing that sight is the translational interface between a visual object and a textual relationship, was my… “ahhh, that’s it moment.”

When data intersects with visual science, there needs to be an aesthetic anchoring for knowledge to surface. There has to be an art to the science. Lima shares this Matt Woolman quote; “functional visualizations are more than statistical analyses and computation algorithms. They must make sense to the users and require a visual language systems that uses colour, shape, line, hierarchy, and composition to communicate clearly and appropriately, much like the alphabetic and character based languages used worldwide between humans.”

From his TED2015 talk Lima says, “we can see this shift from trees into networks in many domains of knowledge. This metaphor of the network, is really already adopting various shapes and forms, and it’s almost becoming a growing visual taxonomy.”

Watch Manuel Lima: A visual history of human knowledge

Using data and revealing a world of stories is an art. I’m appreciative of how Lima communicates the aesthetic value of visualization. Turning the complex and the chaotic into meaningful social, political, economic, and human insights is essential. We can’t get so lost in the science of data that we forget the importance of allowing our eyes, and allowing ourselves to both revel in it, and to discover knowledge in the art of data.

Conceptual artist Katie Lewis devises elaborate methods of recording data about herself, be it sensations felt by various body parts or other other aspects of life’s minutiae plotted over time using little more than pins, thread and pencil marked dates. The artworks themselves are abstracted from their actual purpose, and only the organic forms representing the accumulation data over time are left. She describes her process as being extremely rigid, involving the creation of strict rules on how data is collected, documented, and eventually transformed into these pseudo-scientific installations.

From the pen of John (cofounder)

Please visit Mentionmapp today!

A Big Nerd Talking Data. Meet DataHero’s Chris Neumann

chris-neumann

There’s no escaping the fact that data is a hot topic and big business. However, so much of the buzz about data is usually prefaced with the word “Big” these days. Somehow, the conversation has moved from the fact there’s this huge proliferation of data and the fact there’s potential gold attached to mining it, to the size matters story.

There’s also no escaping it: Chris Neumann, founder of Vancouver’s DataHero is a really big nerd. With almost a ten year lens on the business, Neumann can talk about data in the sense of size really not mattering.

His data lineage goes back to being employee number one with AsterData (acquired by Teradata in 2011 for $263 million)  and saying “I’d argue that Aster Data had the single strongest overall teamever in the data world.  To-date, Aster Data alum have raised over $300 million for companies they subsequently founded, including Nutanix, Instart Logic, ThoughtSpot, and ClearStory Data. That network has remained extremely tight, with many of us helping each other out over the years in a wide variety of ways as we navigated our post-Aster Data endeavours.”

dashboardLooking back on his experience he said, “in 2005, we knew that volumes of data were growing and were on the verge of exploding.  The problem was, databases couldn’t handle such large volumes of data, and the larger data warehouse software that existed was designed for relatively basic workloads (figuring out simple metrics, aggregates, etc.).  Companies large and small were starting to hit up against the limits of existing products and were forced to choose between complex analytics on insufficient amounts of data or insufficient analytics on larger volumes of data.”

It isn’t only big companies generating large volumes of data. Even small internet companies are generating significant amounts of data. The business challenge is making sense of it. So much of today’s focus is on “Big Data,” and figuring out how to keep pace with the increasing amounts of centralized data being generated by a relatively small number of companies.

“What almost no one is talking about is the fact that at the same time centralized data is increasing in volume, enterprise data overall is becoming decentralized as services move to the cloud,” said Neumann. “This has the potential to be an even more significant shift in how enterprise data is managed.”

“My experiences at Aster Data had a significant impact on how DataHero has evolved from its earliest days,” he added. Seeing firsthand the increasing demand for answers to data questions from people outside of the traditional data organizations, and how those departments were quickly becoming a major bottleneck to enterprise efficiency has led him to get past the size conversation. “Those experiences helped me to appreciate how important access to data is to business users and how much need there is for tools to empower users of all technical levels to be able to work with data.”

Entirely new groups of people are working with data. Until now, you had to be a data analyst, a statistician, or a data scientist to be able to get insights from data. Neumann’s all about the democratization of data, and that anyone who has access to data and wants to ask questions of that data should be able to without having to rely on someone else for help.

He shared that “the biggest challenge in building a product designed to empower everyone in an organization is walking the tightrope of having all of the features people need to answer their data questions, while keeping it easy to use and accessible to the largest possible group of users. Data products have historically been designed for technical users, so we’re really focused on the capabilities we’re trying to bring to business users.”

DataHero meetup

This democratizing access to data is about pulling, processing, and analyzing it from SaaS services, cloud storage drives, online spreadsheets, or even files on a laptop.  Neumann said DataHero has expanded its partnerships to include:

  • Pardot
  • Highrise
  • Zendesk
  • Zuora
  • Recurly
  • Mixpanel
  • Keen IO

For marketing, sales, customer service, and software development professionals, there’s less and less friction to working with data today than ever before. It’s about redefining our relationship to the speed of business. Having data in context it’s now more possible for insightful and impactful decisions to be made. and proving ultimately that the size really doesn’t matter.

Top photo by BusinessNewsDaily

Story originally featured in BetaKit

Big Data is More than Just Big Hype

ID-100220001According to Gartner’s 2013 hype cycle for emerging technologies, big data resides almost at the summit of “the peak of inflated expectations”. This means that the next stop is a deep dive into “the trough of disillusionment”, and that big data will reside in a period of technological purgatory for at least 5-10 years.

Needless to say, it looks like someone at Gartner doesn’t buy all of the headlines this past few years..

In hosting an event titled “CIO’s and Big Data” the Vancouver Enterprise Forum attracted enough skeptics, fence sitters, and fan-boys to sell out the VanCity theater. The panel discussion moderated by Delloite’s Jacob Kuijpers featured:

  • Cameron Uganec, Director of Marketing at Hootsuite

  • Stephen Ufford, Founder & CEO of Trulioo

  • Bruno Aziza, VP, Worldwide Marketing at SiSense

  • Tommy Levi, Senior Data Scientist at PlentyofFish.com

In spite of the seemingly growing number of headlines about big data these past few years- particularly this one from the Economist in early 2010, which helped sparked my interest in the subject- Kuijpers suggests it’s really nothing new. He points out that big banks and even Walmart having been crunching big numbers long before this became topical. I comes as no surprise, as mathematics doesn’t really make for the most riveting headlines.

Kuijpers framed the conversation by asking “why is big data seemingly ‘all the rage?’ He offered a working definition as one of “volume, velocity, variety (beyond simply, text, and numbers neatly delineated in columns and rows).” With the addition of mobile-generated data and social media, the sheer volume of information to collect and process today is tsunami-like for most companies. For instance, Kuijpers shares that Westjet estimates they capture approximately 10 terabytes of data from each plane on every flight. One terabyte is one trillion bytes.

What kind of data do you need for your business?

Uganec offers up that “Hootsuite is tracking user behavior to create more tailored and relevant messaging to their users” Talk about volume too, as he said its users are sending four million messages a day.

Aziza spoke about “raising visibility, what’s going inside your company? What’s the relationship between effort and impact (correlation vs causation)?”

For Levi, it “starts with questions relevant to the business, not the tech… forgot the buzz word, it’s not magic. Start small… Small samples that are statistically relevant can produce valuable results too.”

On one hand Aziza also made the point that “there should be no constraints in terms of what or how much data to collect as it’s so cheap to store now. Collect it all. In so many cases people don’t know what data to collect.”

Yet Ufford talks about the calculating and computing costs as being potentially astronomical if you don’t have a data science plan. “We got the bill! $130,000 from Amazon Web Services bill to crunch the data to get an answer for 3 questions! Businesses want answers, whereas data guys want data.”

Levi appreciates that there’s huge challenges in terms of collecting and storing data. “How and when, and when to extract data is a further a challenge. As the scientist on the panel points out, it’s crucial to have a well thought out foundation in terms of how you organize the data. It’s data science: form a hypothesis and test it.”

Does Big Data matter?

Uganec has no qualms suggesting “we are at the peak of the hype curve. Delivering insights is what matters most.”

For Aziza “the word big is relative. What’s the subjective value of the data?” He offers up the analogy “that data equals the elephant; the rider of the elephant is the data scientist… ensuring the elephant from simply running amok.”

Is Big Data only for big companies?

Aziza doesn’t see this about the size of a company, it’s about  telling him what he doesn’t know. “Do your infographics actually deliver useful information, or just look pretty, which means it’s just art! Understand what’s going outside your walls… Competitive insights matter.”

From a startup perspective Ufford offers “the best entry point is asking what’s the most difficult, most onerous, pressing question for big companies or an entire market,” he said. “Tackle those answers and with enough runway a startup can be left holding something of value.”

Why do they see in the future for Big Data?

In terms of wrapping up the conversation Levi was on mark by reinforcing that “the value of big data resides in the quality of the questions you ask from it. Know your core business! Data needs to be telling a story!”

Probably the most salient point of the evening was Aziza saying “we need to figure out the relationship of data to people… we need to make data work for “us”.

For the serious and the curious big data can transcend the hype, and make a significant impact beyond just business. It will be a key aspect for improving healthcare for instance.  While machines might churn through 0’s and 1’s at mind altering rates and efficiency, they’ll not supplant our capacity to tell meaningful stories any time soon.

This story was originally published in BetaKit